SANS has released the 2025 edition of its annual State of ICS/OT Security survey series, and I’ve continued to dig into its results. In my last blog, ICS/OT Initial Attack Vector Trends 2021-2025: Analysis of SANS Survey Data and the Path from Craft to Science, I focused on access vectors that have shown decline over the last four years, and those that appear to be increasing.[1]
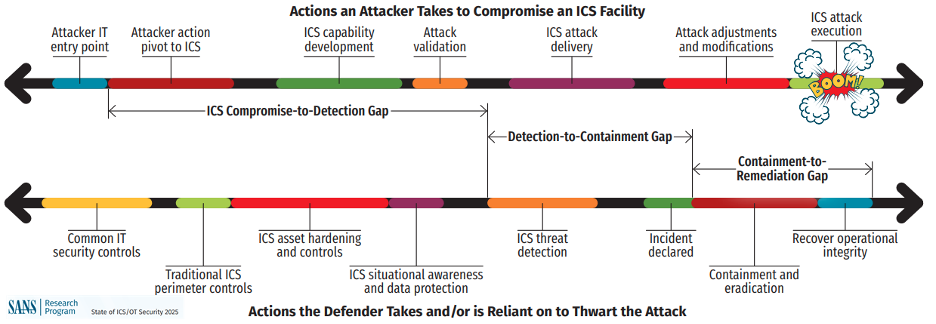
In this blog, I’m focused on survey data related to the ICS Cyber Incident Timeline and how each major stage—Compromise-to-Detection, Detection-to-Containment, and Containment-to-Remediation—has changed over this period. I also show how changes to these timeframes can be financially quantified as cyber risk, including the potential for material revenue losses.
My intention is to go beyond the annual analysis by SANS and perform a year-over-year (YoY) comparison to see how much industry response timelines have changed.
SANS Survey Sources(2024–2025)
For reference, these are the historicalsurvey editions I'm using:
- 2023 and prior – applicable questions were not commissioned yet.
- 2024: SANS 2024 State of ICS/OT Cybersecurity – 530 survey responses.[2]
- 2025: State of ICS/OT Security 2025 – 330 survey responses.[3]
Thank you to the SANS team (including Tim Conway, JasonChristopher, Robert Lee, DeanParsons, and many others) for continuing to publish this survey series and sharing results with the community.
Initial Thoughts onSurvey Population and Potential Biases
The SANS ICS/OT security surveyparticipants are a community of professionals that have some level ofresponsibility for OT cybersecurity. By participating in the SANS ICS/OTcommunity is a signal that these individuals are more mature than those that donot. This is good in that it increases the accuracy of the data, but it is badbecause the population excludes companies that don’t have individuals that follow SANS or have OT but don’t have any OT cyber skills/experts.
Smaller Population - The second observation is a 38% smaller survey population, adecline from 530 to 330 participants in this 2025 data. A smaller populationdoesn’t mean it isn’t valuable, but it does mean the uncertainty of the results has a wider margin of error.
Different Top Vertical - The last observation in the survey data is the top industryvertical has changed. In 2022 and 2024 reports, the top industry vertical isInformation Technology. In 2023 and 2025 reports, the top industry vertical isEnergy (aka., electricity, oil & gas). As cybersecurity risks, regulations,and cultures differ across industry verticals, this can cause the differencesbetween verticals to influence results.
Summary of SANS ICSCyber Incident Timeline Results
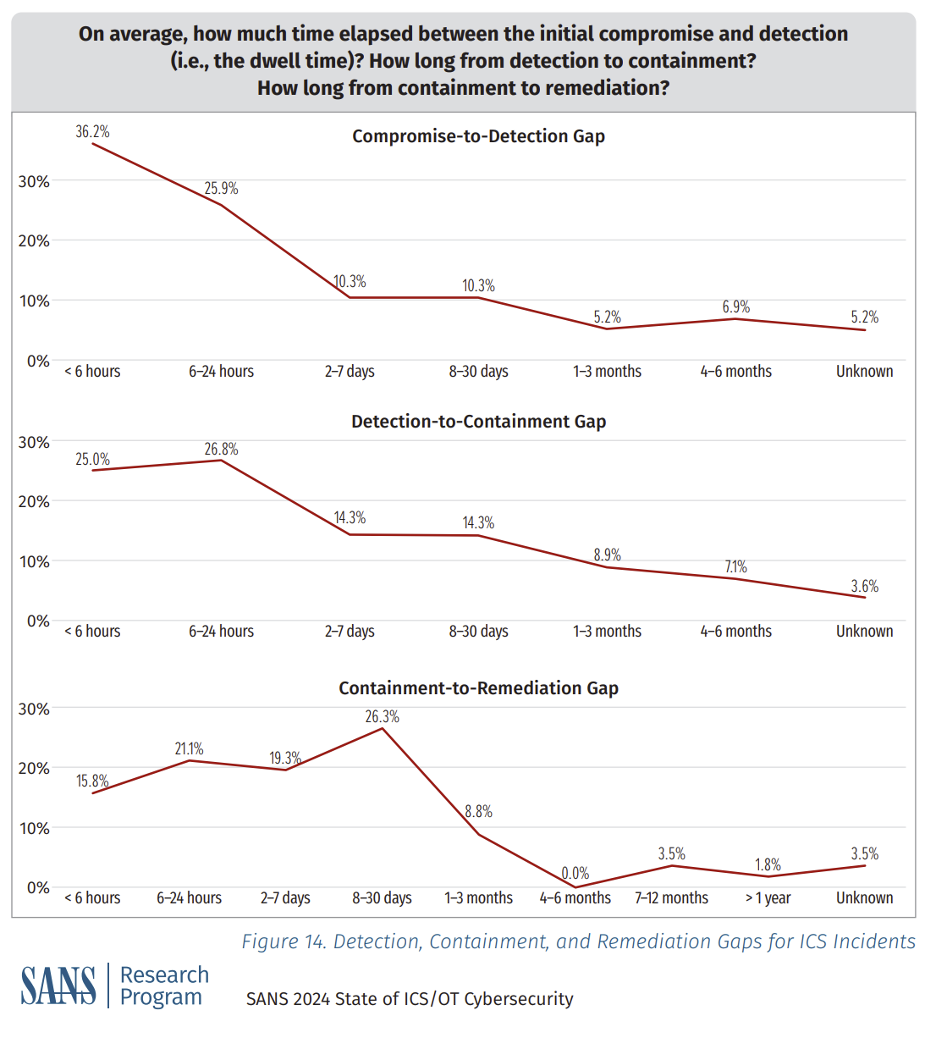
Here is the data from the 2024 report.
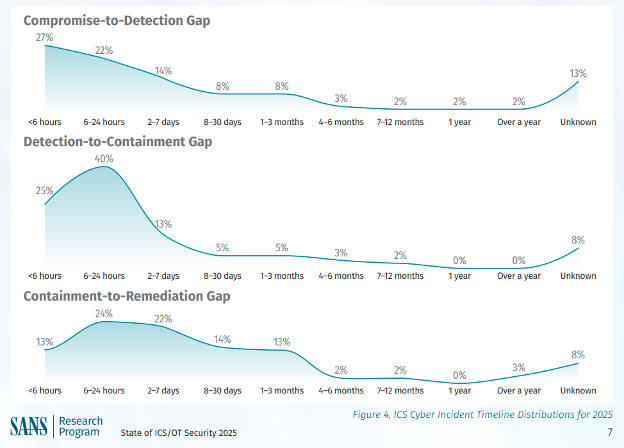
Here is the data from the 2025 report.
SANS assessed the following improvements,
- “Industry continues to improve in detection times for ICS/OT incidents, with nearly 50%of incidents being detected within the first 24 hours. Second, we are similarly improving on containment, with over 65% of detection-to-containment gaps being addressed in theproceeding 24 hours. That means, on average, ICS/OT incidents are detected and containedwithin 48 hours.” [3]
- “Remediation, which includes the act of eradicating the threat andrecovering operational integrity, still takes days to achieve, on average, with 22% taking two to seven days to recover. The risks here are real, with 19% of incidents in 2025 taking over a month to remediate (and astriking 3% taking over a year).” [3]
SANS assessed the following declines,
In the following sections, we will go beyond the SANS analysis as well as financially quantify the cost of taking over a month to remediate.
Deeper Analysis by DeNexus
My first task was to overlay the 2 data sets and see what additional analysis I could discover. Because there are 3 different attack stages, there is one chart for each of them.
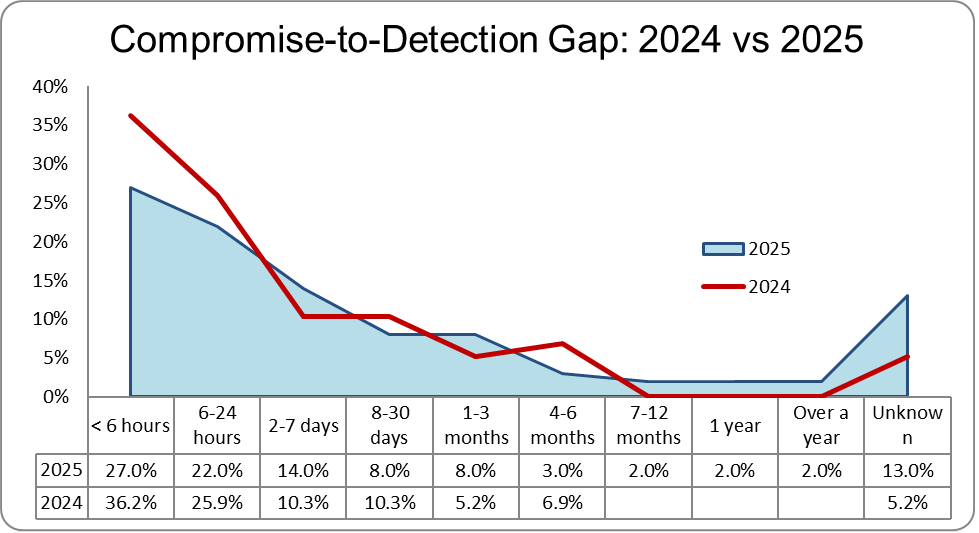
From visual analysis, compromise-to-detection under 24 hours has declined.
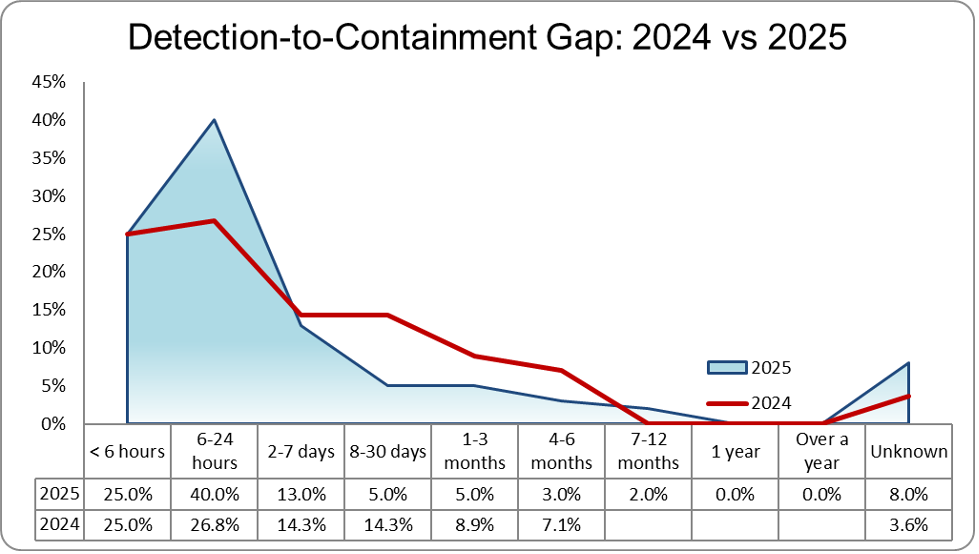
From visual analysis, detection-to-containmenthas shifted left, which is a positive sign of improvement.
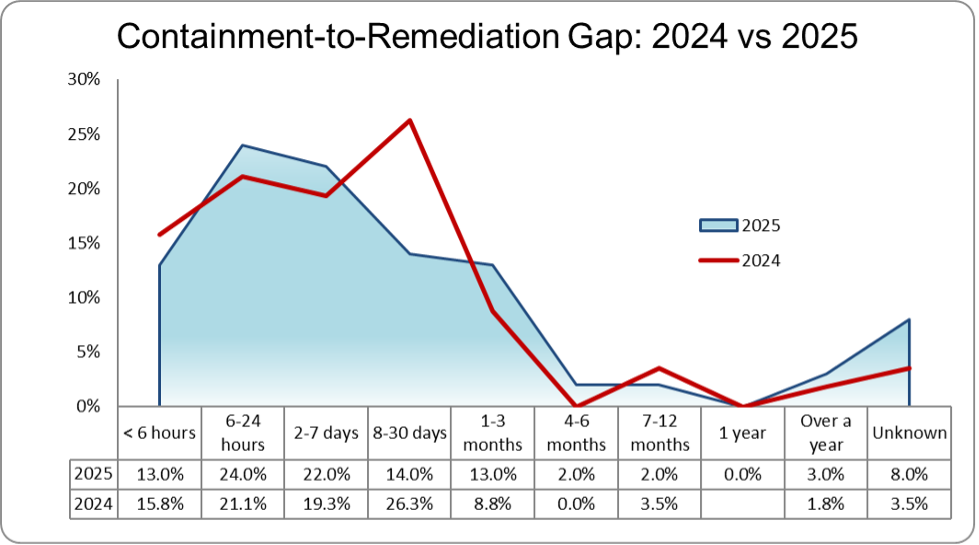
From visual analysis, containment-to-remediationhas a slight worsening under 6 hours, but a net positive improvement under 1week.
What about cumulative results?
For this next analysis, I wanted to see ifthe overall population is improving, by looking at the cumulative trends forthe time-series buckets used in the survey.
Compromise-to-Detection has gotten Worse
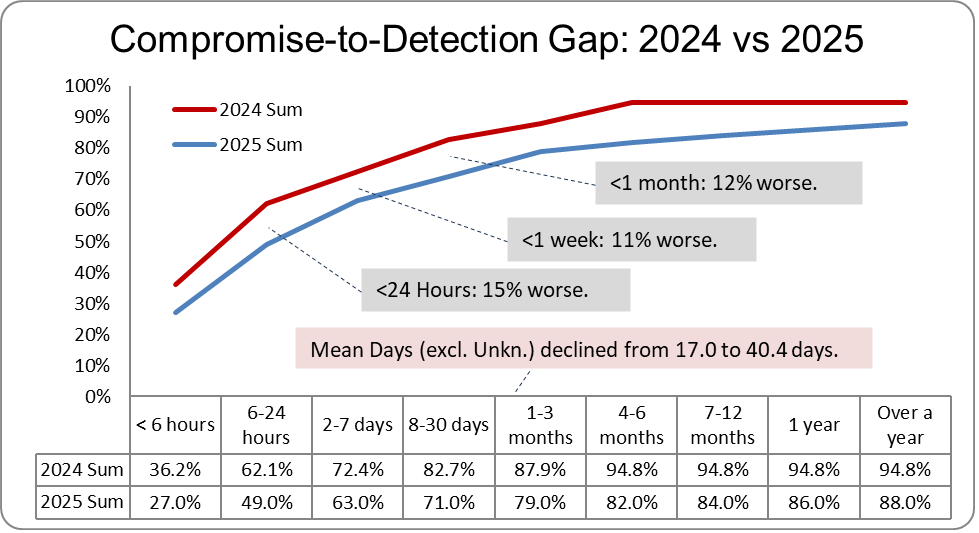
Cumulative review of compromise-to-detection data shows more startling results: acontinuous decline across all time-series buckets. SANS reports that industrycontinues to improve in detection times for ICS/OT incidents, with nearly 50% of incidents being detected within the first 24 hours.[3] Dragos reports thatnearly 50% of incidents in 2025 were detected within 24 hours.[8] I agree that nearly 50% are detected within 24 hours, but comparing cumulative data reveals a 15% decline incompromise-to-detection under 24 hours (not an improvement as SANS and Dragosclaim).
Extrapolatingthe data further to determine the average, Compromise-to-Detection mean days (excluding Unknown)have worsened from 17.0 to 40.4 days.[4]
Detection-to-Containment has Improved
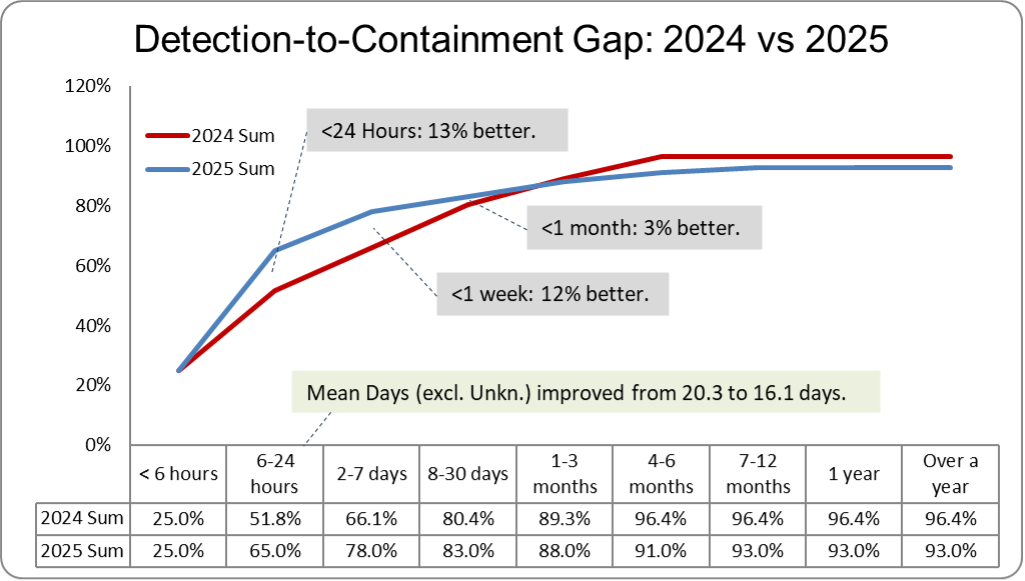
Cumulativereview of detection-to-containment data shows the overall population is shifting left, as shorter duration time-buckets have growth and very long-duration buckets have declined. This is the type of observation that we would hope for: a continual left shift, revealing that detection-to-containment under 24 hours has improved 13% and under 1 week has improved 12%.
Extrapolating the data further to determine the average, Detection-to-Containment mean days (excluding Unknown) have improved from 20.3 to 16.1 days.[4]
Containment-to-Remediation has also gotten Worse
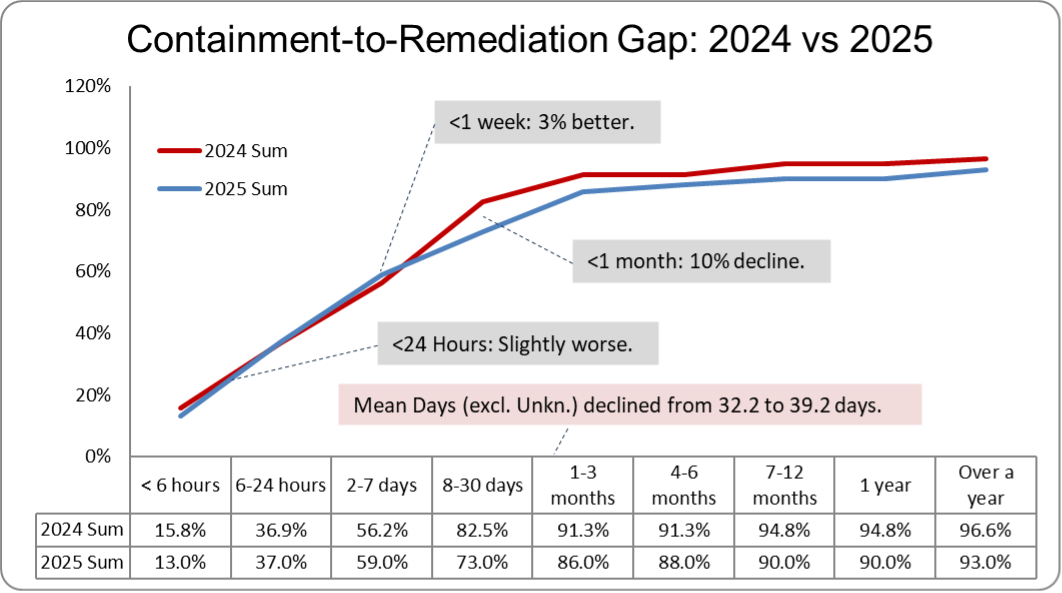
Cumulative review of containment-to-remediation appears generally the same (within 3%) asthe prior year for remediation under 1 week. For all buckets greater than 1week, the cumulative data shows an overall decline.
We would hope to see slight growth on the left side of the graph and decline on theright. Only containment-to-remediationunder 1 week has improved by 3%, all other ranges are in decline.
Extrapolating the data further to determine the average, Containment-to-Remediation mean days (excluding unknown) has worsened from 32.2 to 39.2 days.[4]
How this Translates to Cyber Risk and Financial Losses?
Using the NIST Cyber Security Framework (CSF) 2.0, functions that occur before detection(i.e., Protect) help reduce the probability of compromise.[5] Functions thatsupport response after compromise (i.e., Detect, Respond, Recover) help reducethe severity of impact.
The SANSsurvey claims that participants suffered an ICS/OT cyber incident.[3] We therefore assume the initial compromise is confirmed (i.e., post-incident) andall further efforts reduce severity of impact. We don’t know from the SANS survey data whether compromise led to impact, but we can apply the mean daysfor each stage as the average length of the cybersecurity incident and, by extension, the duration of impact.
In the following chart, the cumulative mean days for each stage of the ICS cyber incident is shown.
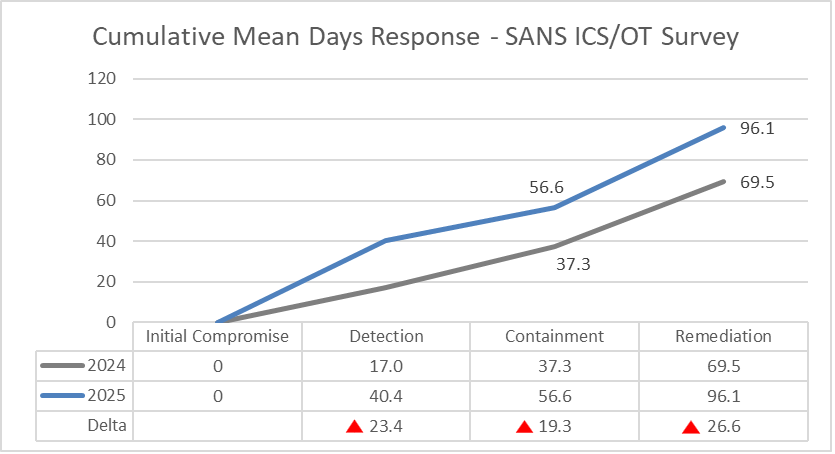
The cumulative mean days for each stage ofcyber incident response shows that all stages have increased duration.
Let’s use a home fire as an example to help explain the implications. Instead of hours, I will use minutes.
- It used to take 17 minutes todetect the fire, and now it takes 40 minutes, 23 more minutes for the first to spread.
- It used to take 37 minutes for firedepartment to arrive and contain the fire (to prevent further spread), and nowit takes 57 minutes, that is 19 more minutes of damage.
- If it used to take 70 minutesto extinguish the fire, but now it’s 96 minutes, of course the total damage will be higher.
This concept applies directly to cyberincident response as well. Longer timeframes have direct relationship to increased severity of impact, and financial losses. That includes the high-frequency low-impact phishing impact, as well as the low-frequency high-impact targeted ICS/OT cyber-attack. Both are affected by longer timeframes.
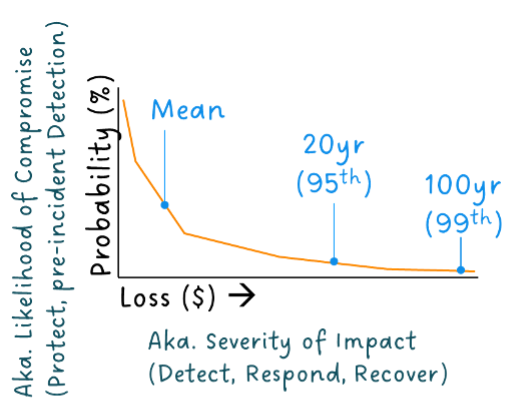
In the illustrative chart above, called a loss exceedance curve (LEC), the line represents a distribution of potential cyber-attacks, their probabilities, and loss magnitude. I’ve overlayed the cybersecurity functions that have the strongest relationships to the X and Y axis. Improving protection and pre-incident detection shifts the curve down, lowering probability. Improving post-incident detection, response and recovery shift the curve left, lowering loss magnitude. Improving either security function causes the entire curve to appear lower, effectively reducing cyberrisk through reduced financial losses. This is a simplification of how cyberrisk quantification determines financial risk.
Phishing typically dominates the area tothe left (i.e., high-frequency low-impact), while catastrophic cyber-attacks dominate the area to the right (i.e., low-frequency high-impact). As you gofurther right in the LEC, the rarer events (e.g., 1-in-100 year) are represented as the ‘tail’. If the very rare incident is VERY high impact, itcauses the graph to have a very long tail.
An increasing compromise-to-remediation timeframe increases the tail and increases the mean loss (aka., annual loss expectancy, ALE). In simple language, if it takes longer to detect and remediate, the financial impact is higher.
Simplified Cyber Risk Quantification (CRQ) Example
Let’s assume a manufacturing facility that operates 24/7 with $800M annual revenue. The average revenue loss is $92,000 per hour, not including fixed costs, labor, or materials. If they experienced avery rare high-consequence cyber-attack:
- Per 2024 compromise-to-remediation:69.5 days = $152M (19% of annual revenue)
- Per 2025 compromise-to-remediation:96.1 days = $211M (26% of annual revenue)
- An increase of 26.6 days = $58M(7% more annual revenue)
That is 26.6 additional days of downtime,not including potential equipment damage, response costs, remediation costs, supply chain impacts, etc. The actual cyber incident cost is potentially 2-5X more.
Improving the ICS cyber incident response timeframes reduces cyber risk, and through financial quantification this can be measured. In a full CRQ analysis, many otherfactors would be taken into consideration beyond the response timeframes. Thisincludes effectiveness of controls, existing vulnerability exposure, OT network architecture, industry vertical, site-specific financials, with more advanced probabilistic analysis.
Final Thoughts
The SANS surveys provide a valuable service to the community by publishing data on issues that matter to ICS/OT cybersecurity. Deeper analysis of the data showsthat:
- Compromise-to-Detection has worsened from 17.0 to 40.4 days.
- Detection-to-Containment has improved from 20.3 to 16.1 days.
- Containment-to-Remediation has worsened from 32.2 to 39.2 days.
When thisduration is accumulated across the ICS cyber incident timeline, the results aredisappointing:
- Detection is taking 23 days longer.
- Containment is 19 days longer.
- Remediation is 27 days longer.
In our simple cyber risk quantification example, a longer response timeline increases financial losses by up to 7% of annual revenues (for a low-frequency, high-impact long-tail incident).
With the SANS Survey data, any theories as to why this increase has occurred is speculation. Potential reasons include:
- Survey Population: Shrinking overall survey population, changes in the survey demographics, and even contribution by region. Not all survey participants provide response timeframes, reducing thedata set population even further.
- If 2 verticals have different profiles, it skews the average.
- External Threat Landscape: Adversaries are getting better at compromising and remaining undetected, and frequency is increasing.[7]
- Stolen credentials are being used more frequently, which are harder to detect.
- Dragos’ ransomware analysis repeatedly highlights exploitation of interconnected IT/OT environments and cascading impacts.[7]
- This could be a sign of threat actors using AI. IBM Cost of a Data Breach 2025 reports that 1 in 6 breaches involved AI-driven attacks.[6]
- Internal Cyber Incident Response: Asset owners appear to take longer to progress through the ICS cyber incident timeline.
- Visibility gaps at lower Purduelevels make eradication/validation slower.
- Restoring OT requires more time to validate system integrity to safely operate.
- IBM Cost of a Data Breach 2025 reports the global average cost would have been lower if the United States hadn’t surged 9% higher.[6] The SANS report is dominated by participants fromthe US.
- IBM, “76% said the recoverytook longer than 100 days.” [6]
I’m surprised by the increasing response timeframe results, which I expected (and hoped) for year-over-year improvement.All reasons above are plausible and it will be difficult to confirm how much each one contributes to the increase.
In the meantime, I have anotherside-project where I will be using DeNexus DeRISK CRQ to provide the financial ROI of improving incident response timeframes and will report the results in a future article.
Relevant DeNexus Products
• Quantified Vulnerability Management (QVM) – Relevant when the discussion focuses on vulnerability prioritization and risk-based remediation planning.
• Cyber Risk Quantification Management (CRQ) – Relevant when the discussion focuses on quantifying cyber risk in financial terms for decision-making and reporting.
References
[1] “ICS/OT Initial Attack Vector Trends 2021-2025: Analysis of SANS Survey Data and the Path from Craft to Science.” Donovan Tindill, Jan 9, 2026. https://blog.denexus.io/resources/ics-ot-attack-vector-trends-2021-2025-sans-analysis.
[2] "SANS 2024 State of ICS/OT Cybersecurity: Our Past and Our Future." SANS Institute, 10/9/2024. https://www.sans.edu/cyber-research/sans-2024-state-ics-ot-cybersecurity. Accessed 1/23/2026.
[3] "State of ICS/OT Security 2025." SANS Institute, 11/14/2025. https://www.sans.org/white-papers/state-of-ics-ot-security-2025. Accessed 2/4/2026.
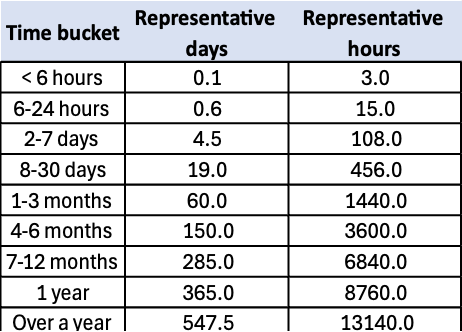
[4] Methodology used to determine mean value: First, the time buckets needed to be converted into their representative days/hours values (i.e., a value in the middle of the time bucket), as they are all different sizes. This representation is then used against the survey data to estimate the mean. The following representations were used:
[5] “The NIST Cybersecurity Framework (CSF) 2.0.” National Institute of Standards and Technology, 2/26/2024. https://doi.org/10.6028/NIST.CSWP.29. Accessed 2/4/2026.
[6] "Cost of a Data Breach 2025." IBM, 9/5/2025. https://www.ibm.com/reports/data-breach. Accessed 1/27/2026.
[7] “Dragos 8th Annual OT Cybersecurity Year in Review.” Dragos, 2/25/2025. https://www.dragos.com/blog/dragos-8th-annual-ot-cybersecurity-year-in-review-is-now-available. Accessed 2/5/2026.
[8] “SANS State of OT Cybersecurity: What the Data Tells Us.” Dragos, 11/24/2025. https://www.dragos.com/blog/sans-state-of-ot-security-2025-what-the-data-tells-us. Accessed 2/5/2026.