ICS/OT Initial Attack Vector Trends 2021-2025: Analysis of SANS Survey Data and the Path from Craft to Science by Donovan Tindill, Director of OT Cybersecurity at DeNexus
SANS has released the 2025 edition of its annual State of ICS/OT Security survey series, and I was excited to dig into the results. In this analysis, I focus on initial attack vectors (sometimes referred to as initial access vectors by MITRE ATT&CK)—a parameter DeNexus has been monitoring since before 2021.
Why? Because it helps answer a fundamental question asset owners and operators ask every year:
What frequency and types of cyberattacks can an industrial ICS/OT organization realistically expect to face?
No one knows the exact frequency or precise mix of attacks any one organization will experience. But by consistently tracking how incidents begin—and how that mix changes year over year—we can make better inferences about attacker behavior, likely exposure paths, and where defensive controls are paying off (or falling behind).
First, a quick thank you to the SANS team (including Tim Conway, Jason Christopher, Robert Lee, Dean Parsons, and many others) for continuing to publish this survey series and sharing results with the community.
Historical SANS Survey Reference Sources
For reference, these are the historical survey editions I'm referencing:
The Data: SANS Initial Attack Vectors (2021–2024)
The table below consolidates the SANS-reported initial attack vectors for 2021–2025. These are the entry paths respondents identified as being involved in OT/control systems incidents.
Note: The SANS 2025 report shifted away from publishing this initial-vector breakdown and instead emphasizes incident types/causes/impacts. I address that shift in the next section.
|
Initial Attack Vector |
2021 |
2022 |
2023 |
2024 |
2025 |
|
Compromise in IT allowed threat(s) into OT/IT network(s) |
40.8% |
40.8% |
38.4% |
45.3% |
- |
|
External remote services |
36.7% |
32.7% |
24.4% |
23.7% |
- |
|
Internet accessible device |
28.6% |
20.4% |
20.9% |
23.7% |
- |
|
Compromised removable media |
24.5% |
36.7% |
9.3% |
20.3% |
- |
|
Engineering workstation compromise |
18.4% |
34.7% |
30.2% |
20.3% |
- |
|
Supply chain compromise |
14.3% |
16.3% |
12.8% |
20.3% |
30% |
|
Spearphishing attachment |
25.5% |
24.5% |
20.9% |
18.6% |
- |
|
Drive-by compromise |
12.2% |
18.4% |
22.1% |
18.6% |
- |
|
Exploit of public-facing application |
32.7% |
32.7% |
23.3% |
13.6% |
- |
|
Data historian compromise |
14.3% |
26.5% |
17.4% |
10.2% |
- |
|
Wireless compromise |
8.2% |
4.1% |
12.8% |
10.2% |
- |
|
Transient cyber asset, including vendor laptops |
0.0% |
0.0% |
0.0% |
8.5% |
- |
|
Unauthorized access (external actor) |
- |
- |
- |
- |
50% |
|
Insider misuse or error |
- |
- |
- |
- |
41% |
|
Ransomware |
- |
- |
- |
- |
38% |
|
Malicious code detection |
- |
- |
- |
- |
33% |
|
Data loss or modification |
- |
- |
- |
- |
21% |
|
Engineering system degradation or outage |
- |
- |
- |
- |
15% |
|
Safety or reliability event triggered |
- |
- |
- |
- |
8% |
|
Unknown (sources were unidentified) |
10.2% |
6.1% |
8.1% |
8.5% |
- |
|
Other |
6.1% |
0.0% |
4.7% |
3.4% |
5% |
Source: Compiled from SANS ICS/OT Security Survey Series (2021-2025)
What Changed in 2025: Initial Vectors vs. Incident Types and Impacts
The most substantial change in 2025 is that SANS no longer reports the initial attack vector breakdown shown in prior years. Instead, the 2025 report emphasizes a different (and useful) framing: a mix of incident categories such as unauthorized external access, ransomware, insider misuse/error, safety/reliability triggers, and supply chain compromise.
That shift is valuable for understanding what kinds of events are occurring and what consequences they produce—but it also means we lose year-over-year continuity on the specific question: "How did attackers initially get in?"
This matters because initial access and impact outcome should be measured as separate dimensions. When they're combined, we reduce the ability to compare against prior years, correlate across surveys, or model changes over time.
ICS/OT Attack Vectors that Appear to be Declining (2021–2024)
Several initial vectors show a downward trend from 2021 through 2024. That does not mean the risk is "gone," but it can indicate improving controls, shifting attacker preferences, or changes in survey population. Regardless, these trends are worth watching.
Trendlines have been added to infer values for 2025, in lieu of SANS results.
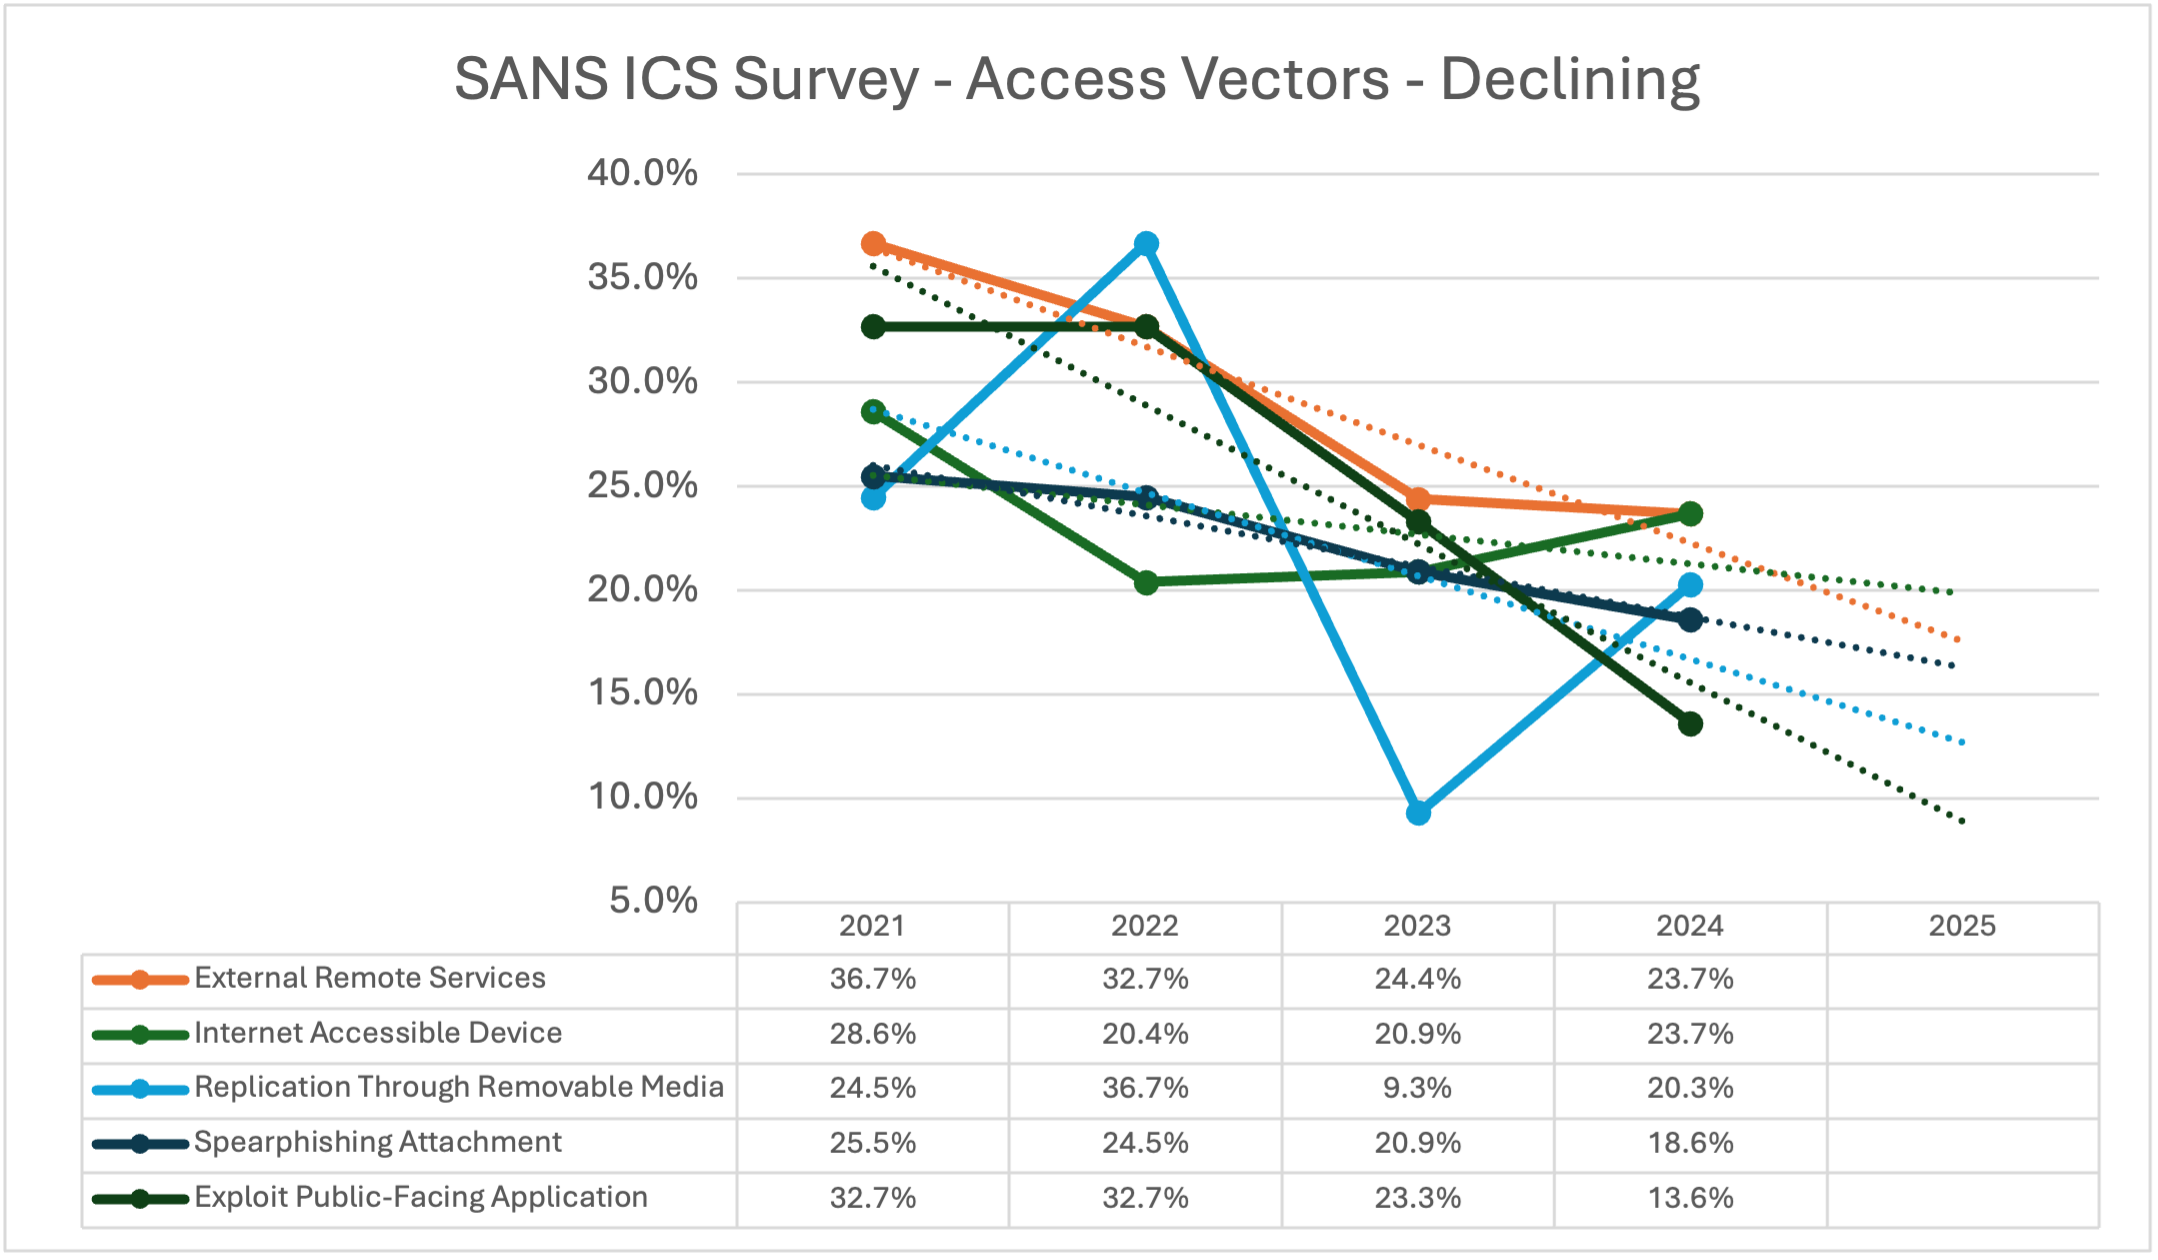
Figure 1: Declining ICS/OT attack vectors from SANS survey data (2021-2024) with projected 2025 trendlines
External Remote Services (T0822, T1133)
This is simply defined as the exposure of any TCP/UDP port through network firewall or router, to an external network, allowing it to be communicated with. It doesn't require a vulnerability to exist; it is simply the exposure of the port that can allow it to be connected to using valid or stolen credentials.
Typical Mitigations: The mitigation to this access vector is to block externally accessible TCP/UDP ports or services with a firewall.
Internet Accessible Device (T0883)
This is defined as an external remote service (aka., T0822) but it is exposed to the Internet, instead of just a company-owned network. Through this exposure, it allows any internet-borne threat actor to connect to the ICS/OT cyber asset using valid or stolen credentials.
Typical Mitigations: The mitigation to this access vector is to block Internet access, or disconnect devices from the Internet.
Replication through Removable Media (T0847, T1091)
This access vector includes USB memory sticks or portable hard drives that are carried into the industrial facility to transfer files from Internet, third-party, company-owned, or other devices into the ICS/OT system, while harboring malware into the environment.
Typical Mitigations: The mitigation to this access vector is to avoid use of portable media, or use malware scanning kiosks, or alternative network-based file transfer mechanisms with native malware detection.
Spearphishing Attachment (T0865, T1566)
This access vector is like email phishing, but is much more sophisticated because the threat actor has researched their targets to provide a more enticing email where the attachment is opened. The attachment itself contains the malware, that when opened infects the target.
Typical Mitigations: The mitigation to this access vector is both technical and training, relying on spam/malware detection, email policies, and frequent phishing training.
Exploit Public-Facing Application (T0819, T1190)
This access vector is both an External Remote Service and Internet Accessible Device, but it also has at least one CVE vulnerability or CWE weakness that allows it to be remotely exploited.
Typical Mitigations: The mitigation to this access vector begins with vulnerability management including vulnerability detection, patching, and verification. Alternatively, it also includes blocking Internet access, or external access to the application with a firewall. Organizations seeking to prioritize vulnerabilities based on quantified business risk rather than generic severity scores can benefit from solutions like DeNexus' Quantified Vulnerability Management (QVM), which helps focus remediation efforts on the exposures that pose the greatest financial impact.
ICS/OT Attack Vectors that are Increasing
The following access vectors have increased over the last 4+ years, according to SANS survey data
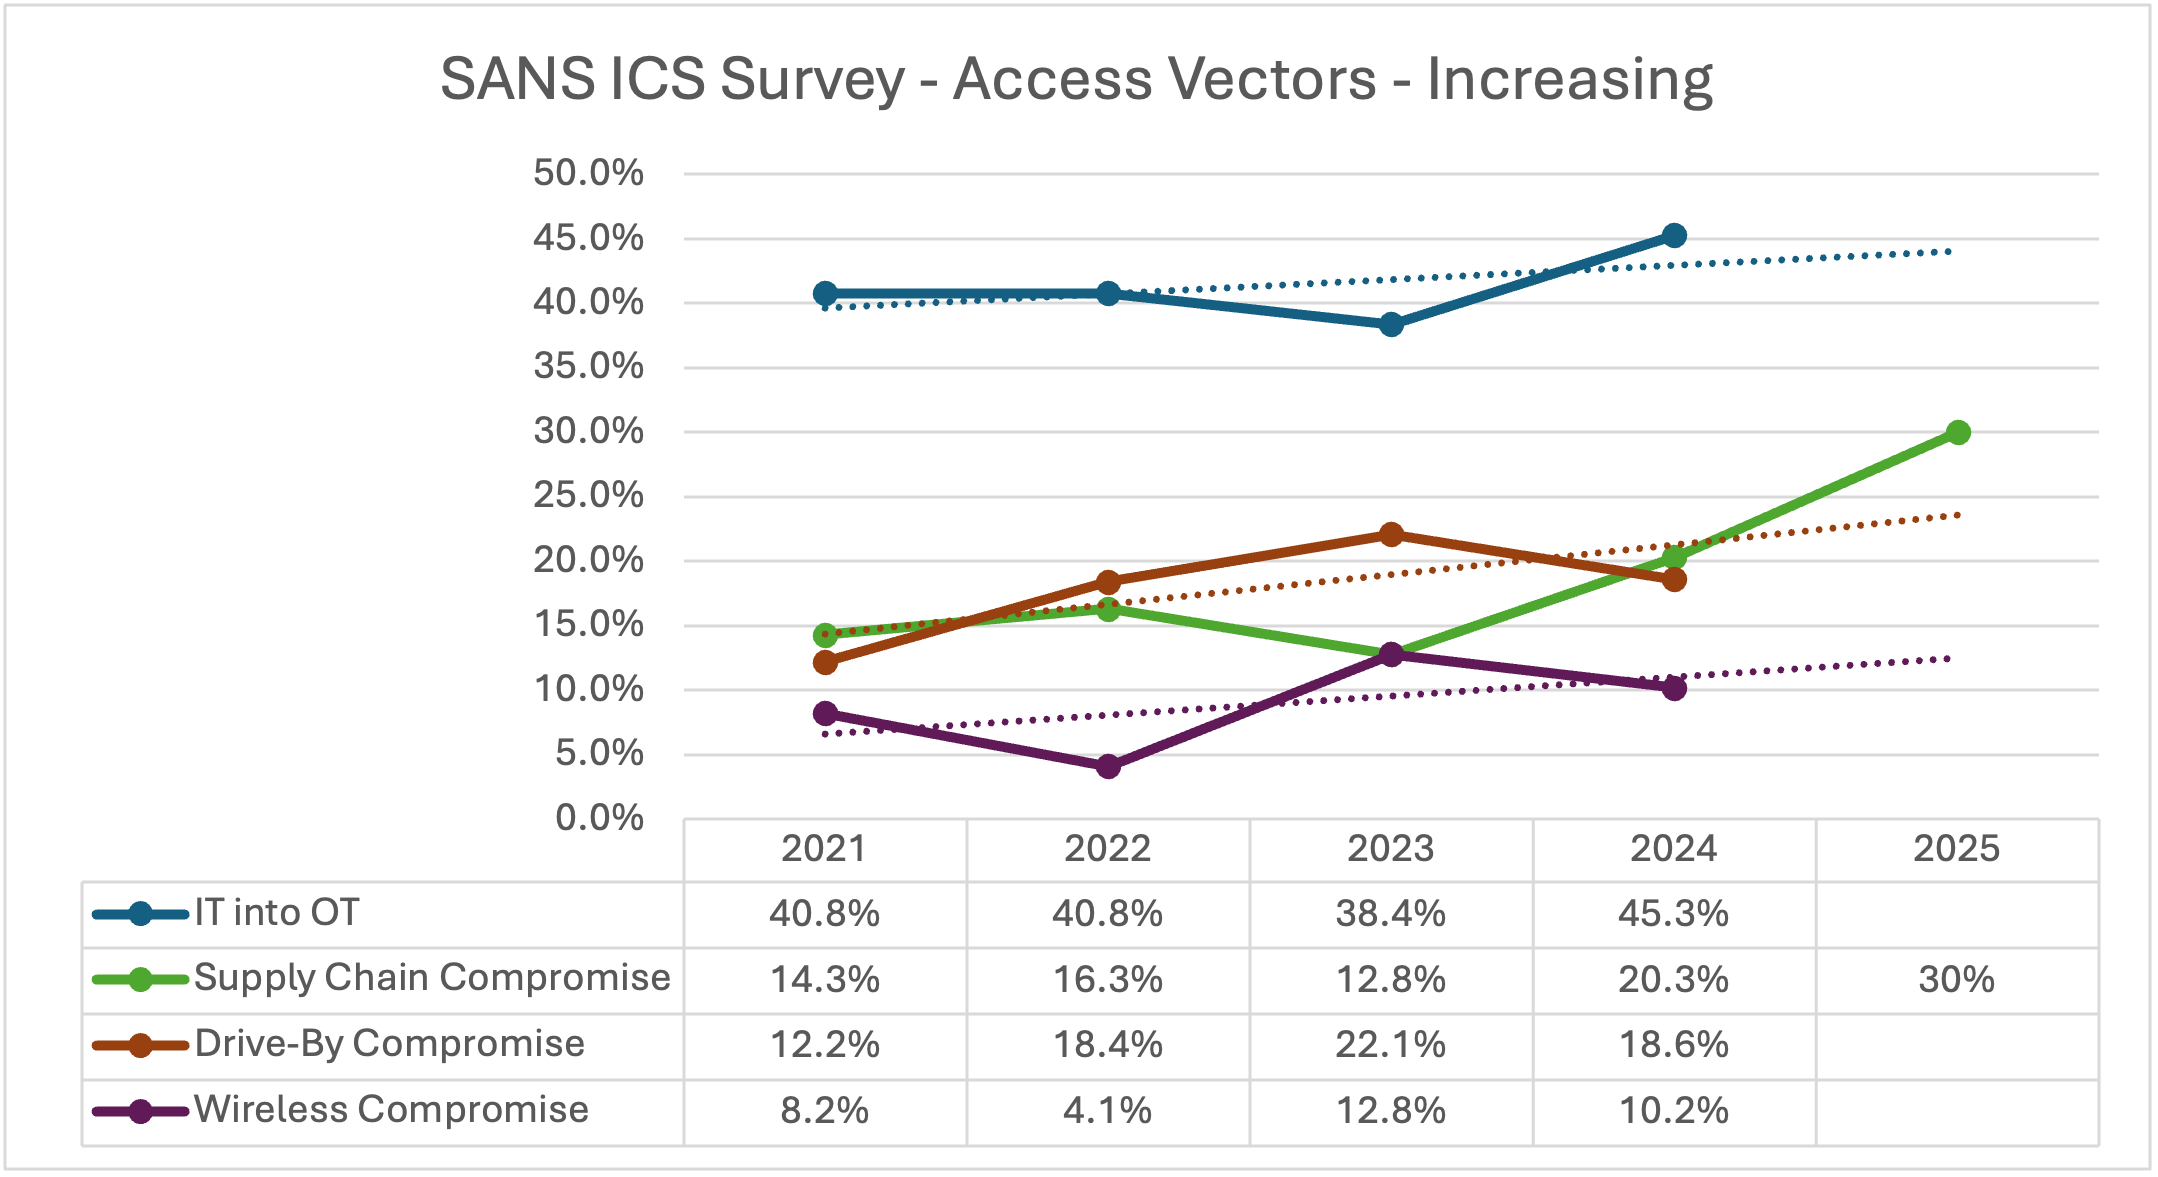
Figure 2: Increasing ICS/OT attack vectors from SANS survey data (2021-2024) with projected 2025 trendlines
Compromise in IT Allowed Threat(s) into OT/IT Network(s)
This is one of the most important and most challenging categories because it is less a single "vector" than a statement about a pathway: attackers use one IAV to enter IT and then pivot toward OT using a different IAV. Multiple access vectors are possible into IT.
Any of the following IAVs are plausible from IT to OT: External Remote Services, Replication through Removable Media, Transient Cyber Asset, Valid Accounts, Hardware Additions, and Wireless/Wi-Fi.
Typical Mitigations: As this is not a single access vector, the mitigation is to address each conduit between IT and OT with their own controls. Start with defensible OT/IT segmentation (including well-designed DMZs), strict remote access governance, high-fidelity monitoring at conduits, and tested detection and incident response that assume the pivot will eventually be attempted.
Supply Chain Compromise (T0862, T1195)
This access vector leverages the third-party relationships with product suppliers, service providers, contractors, consultants, integrators, vendors, and anyone else that are not direct employees of the company. Instead of attacking the intended target directly, their suppliers are used as the access vector into the target environment. This access vector is similar to Trusted Relationship (T1199).
This is the only access vector included in the 2025 SANS survey, alongside the mix of incident impact types.
Typical Mitigations: The mitigation to this access vector is complex, but it begins by identifying the role and criticality of existing supply chain, assessing the risk of each, and implementing controls that help reduce the risk of their access into company networks and systems.
Drive-By Compromise (T0817, T1189)
This access vector is unlike External Remote Services and Internet Accessible Device, because it reverses the connection and relies on the client device or user to make a connection to a compromised device. Also known as a 'watering hole attack', the compromised website or server sits and waits for user connections, and infects those that make connections to it through web browser vulnerabilities, cross-site scripting, etc.
Typical Mitigations: The mitigation to this access vector is complex, but for ICS/OT systems the easiest is blocking outbound/egress communications to prevent them from connecting to untrusted devices.
Wireless Compromise / Wi-Fi Networks (T0860, T1669)
This access vector leverages Purdue Level 0/1 instrument networks using wireless protocols, or more common 802.11abgn Wi-Fi networks found on laptops and tablets, by exploiting the non-wired communications infrastructure to gain access to protected systems over wireless frequencies.
Typical Mitigations: The mitigation to this access vector includes authentication, mutual authorization, encryption, rogue device detection, as well as signal strength tuning.
Improving Future ICS/OT Security Survey Results
I routinely look at the year-over-year (YoY) results from SANS, IBM, Verizon, and CS2AI and the following challenges with all their data include:
Lack of Standardized Access Vectors
Survey authors often define custom vectors, or combine access and impacts into one list. The community benefits when access vectors map to standardized frameworks (e.g., MITRE ATT&CK for ICS) and remain consistent year over year.
MITRE has kicked off the PIVOT (Platform Independent Vectors of Techniques) project and it signals that all MITRE ATT&CK frameworks (i.e., Enterprise, ICS, Mobile, etc.) are merged. A sophisticated actor could use any technique, from any framework, as appropriate to the platform they are attacking. DeNexus recommends using access vectors from both ATT&CK for ICS and Enterprise as they are both effective at disrupting ICS/OT platforms.
Lack of Standardized Cyber Impacts
Once again, each survey author defines unique definitions of cyber-physical impact to ICS/OT systems, but this prevents correlation of data between other surveys. DeNexus recommends using the impact tactics to the right of Command & Control from the MITRE ATT&CK frameworks for reporting (i.e, Exfiltration, Inhibit Response, Impair Process Control, and Impact).
Lack of Standardized Loss Reporting
We need a clearer model for OT-relevant losses, not just IT-centric categories. The FAIR-MAM (Materiality Assessment Model) framework is a good start for IT environments—but needs to be augmented to consider property/equipment damage, safety consequences, extended downtime, and cascading dependencies. Surveys and incident reporting should include which financial losses occurred, and approximate costs.
Address Participant Bias Transparently
Survey populations vary. Respondents who already have defined OT cybersecurity roles may represent a more mature subset than the overall population of asset owners/operators. As a result, the SANS results are probably higher maturity than the majority.
Enable Cross-Survey Correlation
If multiple surveys align on shared taxonomies for access vectors, impacts, and loss categories, we can compare SANS vs. other datasets (e.g., CS2AI, Cyentia) and derive higher-order insights.
Do Year-Over-Year Analysis on the Questions That Matter
Demographics are useful each year, but questions like initial access vectors, impacts, and losses compound in value when tracked consistently.
Design Surveys with the End in Mind
Each question should exist because it will drive analysis and decisions—not only because it is interesting.
What does this mean for practitioners? ICS/OT cybersecurity needs to evolve from following "best practices because experts say so" toward using data-driven evidence to prioritize what reduces risk most efficiently.
Move from expert judgment to data-driven decision-making. From craft to a science.
We Need More Data-Driven Evidence for ICS/OT Cybersecurity
Insurance companies and actuaries can leverage decades of loss history to estimate future risk with increasing accuracy. Cyber loss data—particularly OT cyber loss data—is far less mature.
Several forces contribute to this:
Reputational Pressure
Even when sophisticated actors are involved, organizations often fear reputational damage if details become public.
The Cybersecurity Disclosure Paradox
We need openness to improve security, but incident details are often kept confidential.
Minimum Disclosure Requirements Don't Yet Create Research-Grade Datasets
Many disclosures do not provide sufficient detail on impacts and losses to allow meaningful benchmarking or academic analysis. Today's SEC 8-K/10-K minimum requirements don't address cyber professional's needs who want to learn true impacts from others.
What needs to change is better standardization of the minimum information captured for cyber incidents and better availability of anonymized datasets (from government, ISACs, law enforcement) the industry can learn from.
Conclusion: Turning Limited Data into Better Decisions (and Better Data into Better Outcomes)
ICS/OT cybersecurity has a structural data problem that most of us can empathize with. Incidents are sensitive, often confidential, and frequently underreported—sometimes for good reasons, sometimes because disclosure can feel like public failure. The result is a familiar cycle: we need more transparency to improve security, but the details that would help the community learn are precisely the details organizations hesitate to share.
The practical answer is not to fall back to intuition alone. It is to do two things at the same time:
- Improve the consistency and depth of the data we collect and share, and
- Use analytic methods that explicitly acknowledge uncertainty, rather than pretending it doesn't exist
For the first part, the ICS community benefits most when surveys and disclosures separate initial access vectors from impact outcomes, align terminology to common frameworks (e.g., MITRE ATT&CK), and go one level deeper by capturing cyber-physical impact and loss categories. Even a minimal standardized dataset—vector, affected asset class, operational consequence, and primary/secondary loss categories—would dramatically improve cross-survey correlation and year-over-year analysis.
For the second part, we should recognize that even limited data is still data. Trend signals like SANS' year-over-year reporting of initial attack vectors help us infer what attackers are using in the real world and how those proportions change over time. That is materially better than relying purely on expert judgment.
This is where DeNexus focuses. DeRISK is designed to help industrial organizations make risk decisions under uncertainty by using available cyber incident data (including signals such as access-vector proportions and trends) to estimate the range of potential financial loss from cyber events. Organizations looking to quantify their cyber risk exposure and translate security findings into financial impact can leverage DeNexus' Cyber Risk Quantification (CRQ) platform, which enables risk-based prioritization grounded in measurable business outcomes rather than subjective severity ratings alone.
The uncertainty in any probabilistic estimate is real—but it is also measurable, and it narrows as more surveys are conducted and more incident and loss details become available.
If we want to move from "best practices because the experts say so" to data-driven decision-making, this is the path: improve the data, quantify the uncertainty, and use both to prioritize what matters most. Move from craft to a science.
Ready to go deeper? Explore DeNexus DeRISK, and see how DeRISK™ CRQ & DeRISK QVM can support data‑driven decisions across your industrial control systems.
Learn more about DeRISK CRQ

Learn more about DeRISK QVM