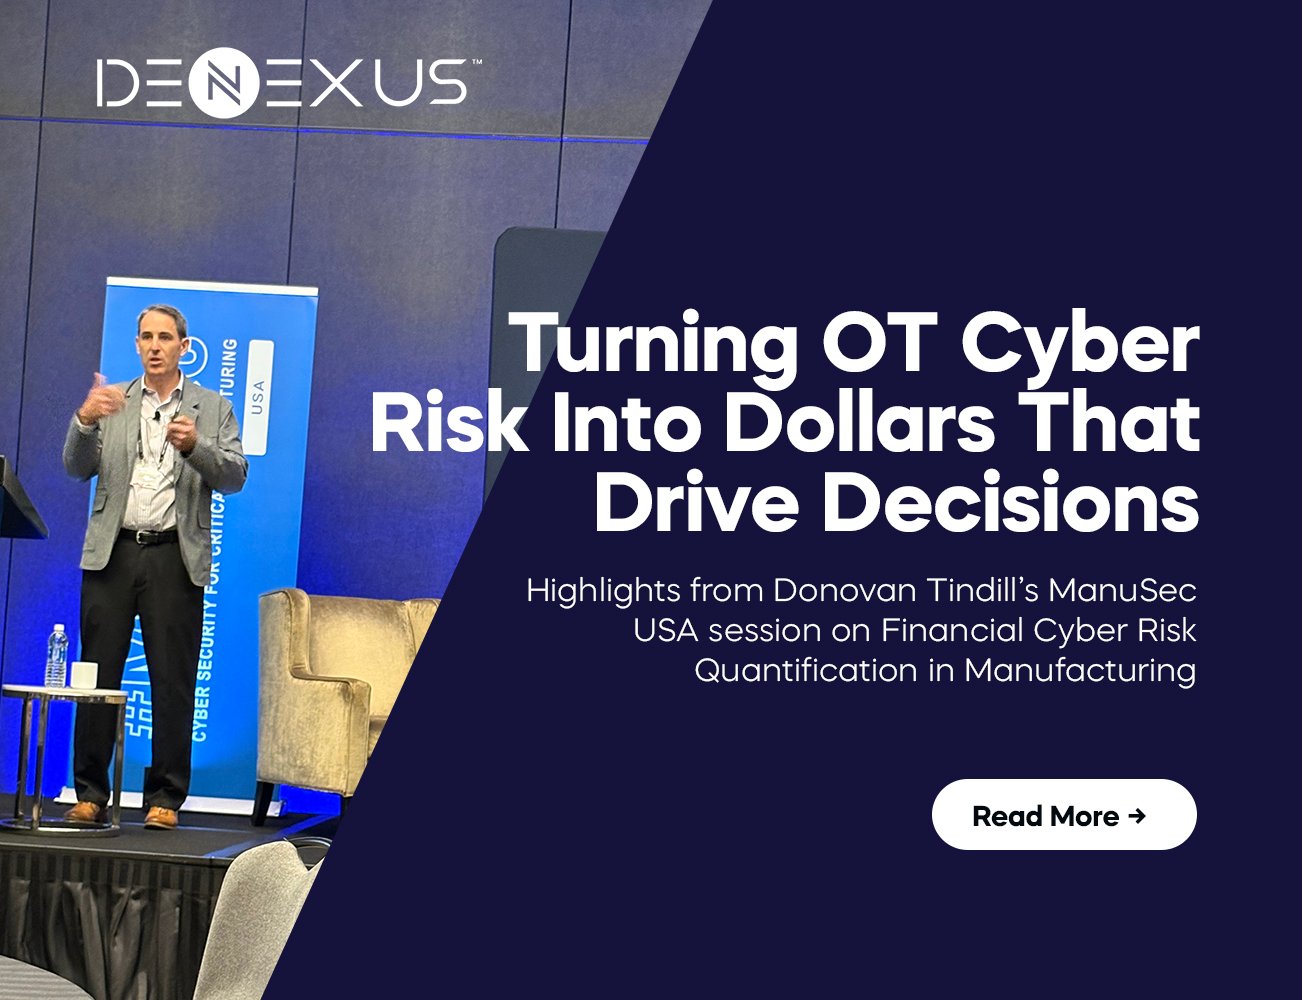
In a recent ManuSec USA talk, delivered by Donovan Tindill, He addressed a question too many OT/ICS teams can’t confidently answer: if a cyber incident shut down your critical manufacturing line for just one day, what’s the financial hit? For most, that’s unknown. And that gap matters.
Qualitative heatmaps and compliance checklists don’t translate into financial decisions. What manufacturing leaders truly need is cyber risk quantification—a way to express potential losses in dollars and integrate cyber risk into business planning.
Below are key takeaways and how each role in your organization can put financial quantification to work today.
Why Financial Cyber Risk Quantification Matters
Instead of arguing over red, yellow, and green, convert cyber risk into financial terms:
- Expected Annual Loss (EAL)
- High-impact low-probability percentiles (e.g. P95, P99)
- How those numbers shift when you improve controls or the threat landscape changes
For Technical ICS/OT & IT Security Teams
Problems you face:
- Limited time and resources
- Fragile infrastructure and uptime pressures
- Security scores (e.g. “9.8”) that don’t align with operational impact
What quantification enables you to do:
- Prioritize by dollar impact
Don’t just chase vulnerability scores—map them to expected loss. A 7.5 might cost more than a 9.8 when it hits your operations hardest.
- Run “what-if” scenarios fast
Ask: “If we add segmentation + MFA, how much does EAL drop? What happens to P95?” You get decisions backed by loss deltas, not guesswork.
- Forecast trends over time
Model evolving risk, new exploits, or improving controls. Show how mitigation shifts loss curves.
Example: Project A (segmentation + MFA) cuts EAL by $170K/year and meaningfully reduces tail risk. Projects B and C offer only partial relief. With quantification, you now know which work delivers the biggest “risk ROI.”
For Cybersecurity & IT Leaders
Problems you face:
- “High risk” slides don’t fly at the C-suite
- CFOs demand real numbers: probabilities, alternatives, time to value
What quantification helps you achieve:
- Business-case clarity
“We need $450K for segmentation + MFA. It saves $170K in EAL and compresses P95 from $1.4M to $0.8M.” That’s capital planning—not fear-based pitching.
- Portfolio-level strategy
Evaluate multiple roadmaps (A, B, A + B) under budget constraints. Show risk reduction per dollar invested.
- Cadence & transparency
“Residual EAL down 40% YoY; tail risk down 30%.” You can track progress over time.
For Risk Managers & Cyber Insurance Teams
Challenges you face:
- Hard to match policy limits and retentions with true ICS/OT exposure
- Negotiation usually guesswork between control spend and coverage
Quantification empowers you to:
- Align coverage with risk
Use modelled P95/P99 to size limits and retentions more accurately—less reliance on guesses.
- Negotiate from evidence
Show insurers how posture improvements shift loss curves to support better premium or terms.
- Jointly optimize transfer vs. internal spend
As your loss curve shifts left, decide where to invest and where to transfer risk.
For CFOs & Finance Teams
Key challenges:
- Cyber competes with maintenance, modernization, sustainability
- Finance wants metrics they can compare
What quantification gives you:
- Comparable financial outcomes
EAL, P95, and risk-reduction per dollar let cyber be evaluated beside other capital projects.
- Reserves & contingency planning
Use residual EAL and tail risk as inputs for capital reserves and planning.
- Proof of performance
“We reduced exposure 30% year-over-year per dollar invested,” not just “we bought new tools.”
How We Do It (Without the Math Lecture)
Our approach:
- Map access vectors and attack techniques (e.g. to MITRE ATT&CK)
- Use statistical data and run large-scale simulations
- Generate loss distributions yielding EAL, P95, P99
- Model shifts when controls or threat environments change
If you already have scenario-driven or hybrid models, that’s fine. The real power comes from consistent, defensible numbers that all roles can speak.
Bottom Line: Speak Dollars, Not Colors
Financial quantification won’t replace your engineering judgments—or the operational expertise you have in OT—but it amplifies them. When OT, security, finance, and risk all use the same numbers, you stop debating colors and start choosing based on financial impact:
- Which vulnerabilities get patched first
- Which legacy devices get replaced
- What coverage and retention levels to pick
- How much capital to allocate
If your team can walk into a leadership meeting with three clear numbers — EAL, P95, and risk-reduction per dollar — the cybersecurity conversation changes. You gain credibility, clarity, and alignment.
Want to bring financial cyber risk quantification into your OT/ICS program?
Contact DeNexus today to:
- Explore a pilot project for your facility
- Tailor a quantification model aligned with your culture
- Build board-ready risk reports your leadership can understand

